83.3%
CSAT
350 satisfied of 420 responses
26
NPS
180 promoters, 70 detractors, 170 passives
±3.6
CSAT margin
95% interval on 420 responses
±6.9
NPS margin
The same 420 responses
How do you calculate CSAT?
CSAT = satisfied responses ÷ total responses × 100.
The question is some version of "how satisfied were you with the help you got today?", on a 1 to 5 scale, and satisfied means a 4 or a 5. Take 420 responses in a month, 350 of them 4s and 5s: 350 ÷ 420 × 100 = 83.3%.
Every response goes in the denominator, including the 1s and 2s. The common way to flatter it is to count 3s as satisfied. If 40 of the other 70 responses were 3s, that turns the same month into 390 ÷ 420 = 92.9%, nearly ten points better for identical work. Top two boxes on a five-point scale is the convention; whatever you choose, write it beside the number. The CSAT calculator runs both scores from your own survey counts.
The 420 answers to the CSAT question
- 83.3%Top two boxes: 350 of 420 answered 4 or 5
- 92.9%Counting the 40 threes too: same month, nearly ten points higher
At a glance
The same 420 responses: CSAT 83.3%, NPS 26
One month, 420 survey responses, scored two ways.
- Measures
- One conversation
- Moved by
- The support team, week to week
- Send it
- A day or two after the conversation ends
- Measures
- The whole relationship
- Moved by
- The whole company, quarter to quarter
- Send it
- On a cadence, quarterly or twice a year
Track CSAT as support's number. Show support's effect on NPS, split by customers who did and didn't need help, rather than reporting the company's score as your own.
How do you calculate NPS?
NPS = (promoters − detractors) ÷ total responses × 100.
The question is "how likely are you to recommend us to a friend or colleague?", on a 0 to 10 scale. 9s and 10s are promoters, 0 to 6 are detractors, and 7s and 8s are passives. On the same 420 responses, with 180 promoters, 70 detractors and 170 passives: (180 − 70) ÷ 420 × 100 = 26.2, reported as an NPS of 26. Put another way, 42.9% promoters minus 16.7% detractors.
Passives count in the total and on neither side, which is why NPS runs from −100 to 100 rather than 0 to 100. It also means the score moves in steps: on 420 responses, ten passives becoming promoters adds 2.4 points, and so do ten detractors becoming passives.
The same 420 customers, asked to recommend you
- 70 · 16.7%Detractors 0–6
- 170 · 40.5%Passives 7–8
- 180 · 42.9%Promoters 9–10
42.9% promoters − 16.7% detractors = an NPS of 26. The 170 passives count in the total and on neither side.
A seven is the answer that catches teams out. On the CSAT scale a customer who is fairly pleased answers 4 and counts as satisfied. On the recommend scale the same customer often answers 7 and counts for nothing. That is one reason the two scores can't be converted into each other, even on the same people in the same month.
What does each score actually measure?
CSAT measures a transaction: did this conversation go well? It is asked about one contact, shortly after it, and it moves with what your support team does this week: how fast they replied, whether the answer was right, whether the customer had to repeat themselves.
NPS measures a relationship: would this customer put their name to you? It is about the product, the price, the onboarding, the last outage and the support team together, and it moves slowly. A support team can lift it, but it doesn't own it, and a quarter of excellent tickets can sit under a flat NPS because the product shipped a change customers didn't like.
That is the answer to the title. A support team should track CSAT as its own number, because it is the score the team's work moves. NPS belongs to the company, and support's job is to show its effect on it, not to report it as a support metric.
When should you send each survey?
CSAT goes out once a conversation has ended, while the customer remembers it. Send it the moment a ticket closes and you catch some customers before they know whether the fix worked; send it a week later and they have forgotten who helped. A day or two after closing is a reasonable middle, and if you track first contact resolution, surveying after the repeat window lets you split CSAT by whether the customer had to come back.
NPS goes out on a cadence, about the relationship, not after a ticket. A quarterly or twice-yearly send to the whole customer base is common. Don't bolt the recommend question onto the CSAT survey: a customer who has just been asked about one ticket answers the recommend question about that ticket, and both scores lose their meaning.
When each survey goes out
- Day 0Conversation endsDon't survey yet: the customer may not know if the fix worked.
- Day 1–2Send CSATAbout this one conversation, while they still remember it.
- Day 7Repeat window closesNow you can split CSAT by whether they had to come back.
- Each quarterSend NPSTo the whole customer base, about the relationship, never bolted onto a ticket survey.
How much can you trust the score?
Less than a single decimal place suggests. Two things limit it.
Sample size. On 420 responses, the 95% margin of error on a CSAT of 83.3% is about ±3.6 points. NPS is noisier, because each response can count as +1, 0 or −1 rather than yes or no: on the same 420 responses its margin is about ±6.9 points. So a month where CSAT moves from 83% to 81% and NPS from 26 to 22 may not have moved at all. Below about 100 responses, a CSAT in the low 80s carries a margin of more than ±7 points, and the number is a direction, not a measurement.
How far the score can wander, by number of responses
- 50 responsesCSAT ±10.3NPS ±20.1
- 100 responsesCSAT ±7.3NPS ±14.2
- 200 responsesCSAT ±5.2NPS ±10.1
- 420 responsesCSAT ±3.6NPS ±6.9
- 1,000 responsesCSAT ±2.3NPS ±4.5
NPS needs about four times the responses for the same margin, because each answer can land in three places rather than two.
| Responses in the month | CSAT margin (at 83%) | NPS margin (at 26) |
|---|---|---|
| 50 | ±10.3 | ±20.1 |
| 100 | ±7.3 | ±14.2 |
| 200 | ±5.2 | ±10.1 |
| 420 | ±3.6 | ±6.9 |
| 1,000 | ±2.3 | ±4.5 |
Who answers. Response rates for support surveys are usually low, and the customers who answer are not a random sample. The very pleased and the very annoyed reply; the quietly fine don't. More responses don't fix that. What helps is keeping the survey, the timing and the definition fixed, so whatever bias there is stays the same from month to month and the trend still means something. Report the response count and the response rate beside every score.
How do CSAT and NPS compare side by side?
| CSAT | NPS | |
|---|---|---|
| Question | How satisfied were you with this interaction? | How likely are you to recommend us? |
| Scale | 1–5 (satisfied = 4 or 5) | 0–10 (promoter 9–10, detractor 0–6) |
| Formula | satisfied ÷ responses × 100 | (promoters − detractors) ÷ responses × 100 |
| On 420 responses | 350 satisfied: 83.3% | 180 promoters, 70 detractors: 26 |
| Range | 0% to 100% | −100 to 100 |
| Measures | One conversation | The whole relationship |
| When to send | Shortly after a conversation ends | On a cadence, quarterly or so |
| Who moves it | The support team, week to week | The whole company, quarter to quarter |
| Margin on 420 responses | about ±3.6 points | about ±6.9 points |
What does a month of CSAT look like? A worked example
The month's 420 responses are the ones drawn above: 350 satisfied, a CSAT of 83.3%. Split, they read like this:
One month's CSAT line, with the numbers that make it honest
| Segment | Responses | CSAT | Margin |
|---|---|---|---|
| All responses4.8% of 8,750 surveyed conversations | 420 | 83.3% | ±3.6 |
| Resolved by the agent | 250 | 85.6% | ±4.4 |
| Handled by the team | 170 | 80.0% | ±6.0 |
| Chat | 230 | 84.3% | ±4.7 |
| 190 | 82.1% | ±5.5 |
Last month 82.1%: up 1.2 points, inside the ±3.6 margin, so reported as flat.
Two lessons sit in that table. First, the gap between the agent's 85.6% and the team's 80.0% looks like a finding and isn't one yet: with 250 and 170 responses, the difference would need to be about 7.4 points before it was more than noise. Second, even if it held, it wouldn't mean the agent is better than the team. The agent resolves the simpler questions and hands the hard ones over, so the team's conversations start further behind. Compare the two over several months and by topic before drawing a conclusion.
The month-on-month change is the same story. Last month was 82.1%, so this month is up 1.2 points, well inside ±3.6. Harbor & Pine reports that as flat and says so, which is what keeps next month's real movement believable.
What should a support team report upward?
CSAT, monthly, with four things beside it. The response count and response rate, so nobody reads a 40-response month as a trend. The change from last month, within the margin or outside it. A split by channel, and by AI-handled against human-handled conversations, since the two are answering different questions. And the operational numbers that explain it: first contact resolution, first response time against your SLA, and handle time.
For NPS, report support's effect on it rather than the score itself. If the company runs NPS, ask for it split by customers who contacted support in the period and those who didn't, and by whether their issue was resolved first time. That comparison is the evidence for support's contribution; the headline NPS is not.
Rule of thumb
A score without its response count is a rumour. Put the count, the rate and the margin beside every CSAT you report, and call a change inside the margin flat.
What does Wiredesk record?
Wiredesk doesn't send CSAT or NPS surveys, so keep the survey you have and route it to conversations the agent handled the same way as to your team's. What it records sits beside your survey rather than replacing it.
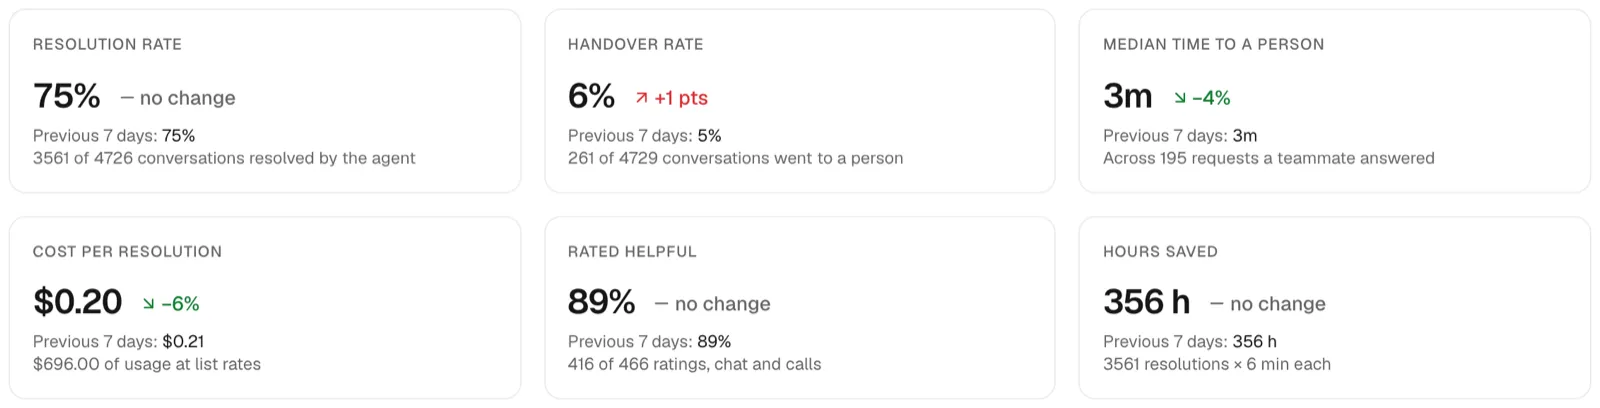
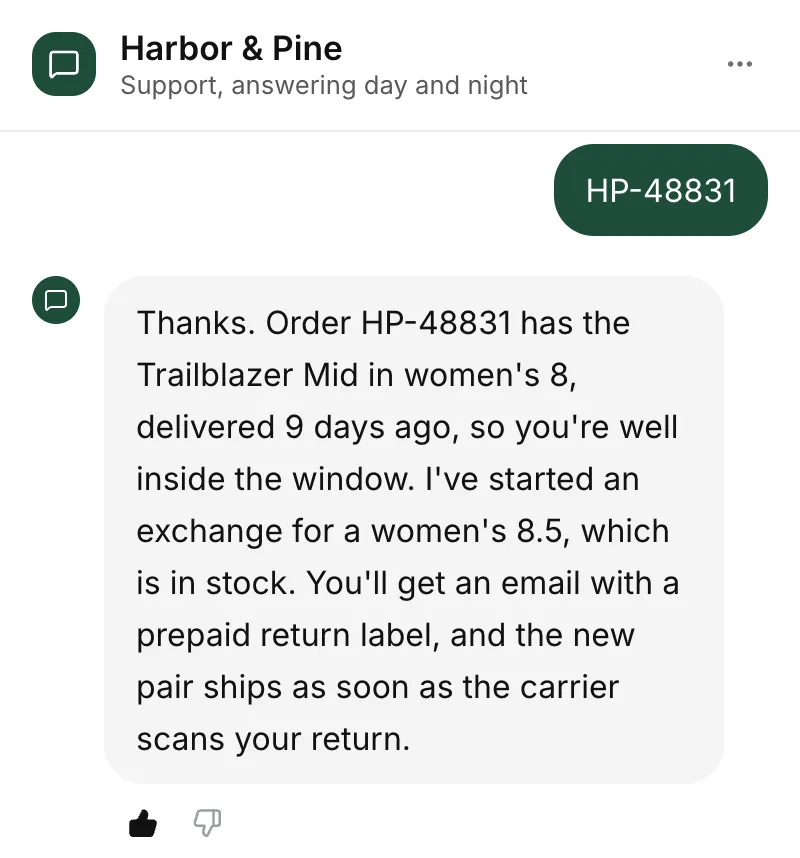
Website chat can show a thumbs up and thumbs down under each of the agent's answers, and on the phone the agent can ask one question as the caller wraps up: "did I get you what you needed today?". Both are off by default, and the agent is told never to ask the call question after a transfer, or of a caller who is upset or in a hurry. The analytics page reports the share rated helpful, across chat and calls, beside the previous period. It counts rated answers, not conversations, so read it as an answer-quality signal rather than a CSAT score. Every finished conversation also gets a sentiment, positive, neutral or negative, from a model's reading of the transcript, which covers the customers who never answer a survey at all.
| Signal | Where it comes from | What it counts | Read it as |
|---|---|---|---|
| Your CSAT survey | Your survey tool, a day after closing | One answer per conversation | How the conversation went |
| Answer ratings | Thumbs under each agent reply in chat | One rating per rated reply | Whether that answer was right |
| End-of-call question | The agent asks once as a call wraps up | One yes or no per call | Whether the caller got what they needed |
| Rated helpful | Analytics, both of the above together | Helpful ratings ÷ all ratings | Answer quality, period on period |
| Sentiment | A model's reading of each finished transcript | Positive, neutral or negative | The customers who never answer a survey |
How do you collect satisfaction signals in Wiredesk? Step by step
Step 1: Turn on answer ratings in chat
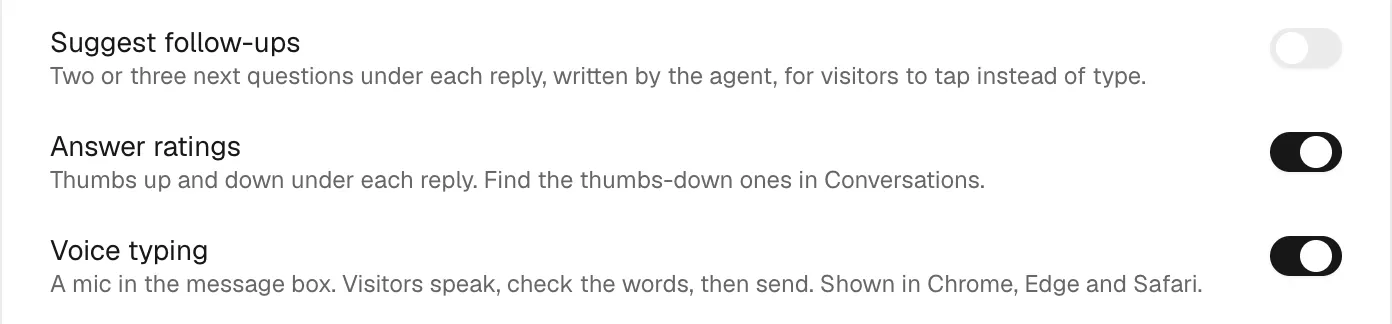
Open the agent, go to Channels and then Website chat, and switch on Answer ratings. The widget then shows a thumbs up and a thumbs down under each of the agent's replies. A visitor can take a rating back, and only the agent's own replies can be rated, never the visitor's words or a teammate's.
Step 2: Ask callers how it went
On the Phone channel, under Rating question, switch on Ask callers how it went. As a call wraps up, the agent asks "Before you go, did I get you what you needed today?" once. A clear yes or no is saved like a chat rating; a caller who doesn't really answer isn't recorded.

Step 3: Read the thumbs-down conversations
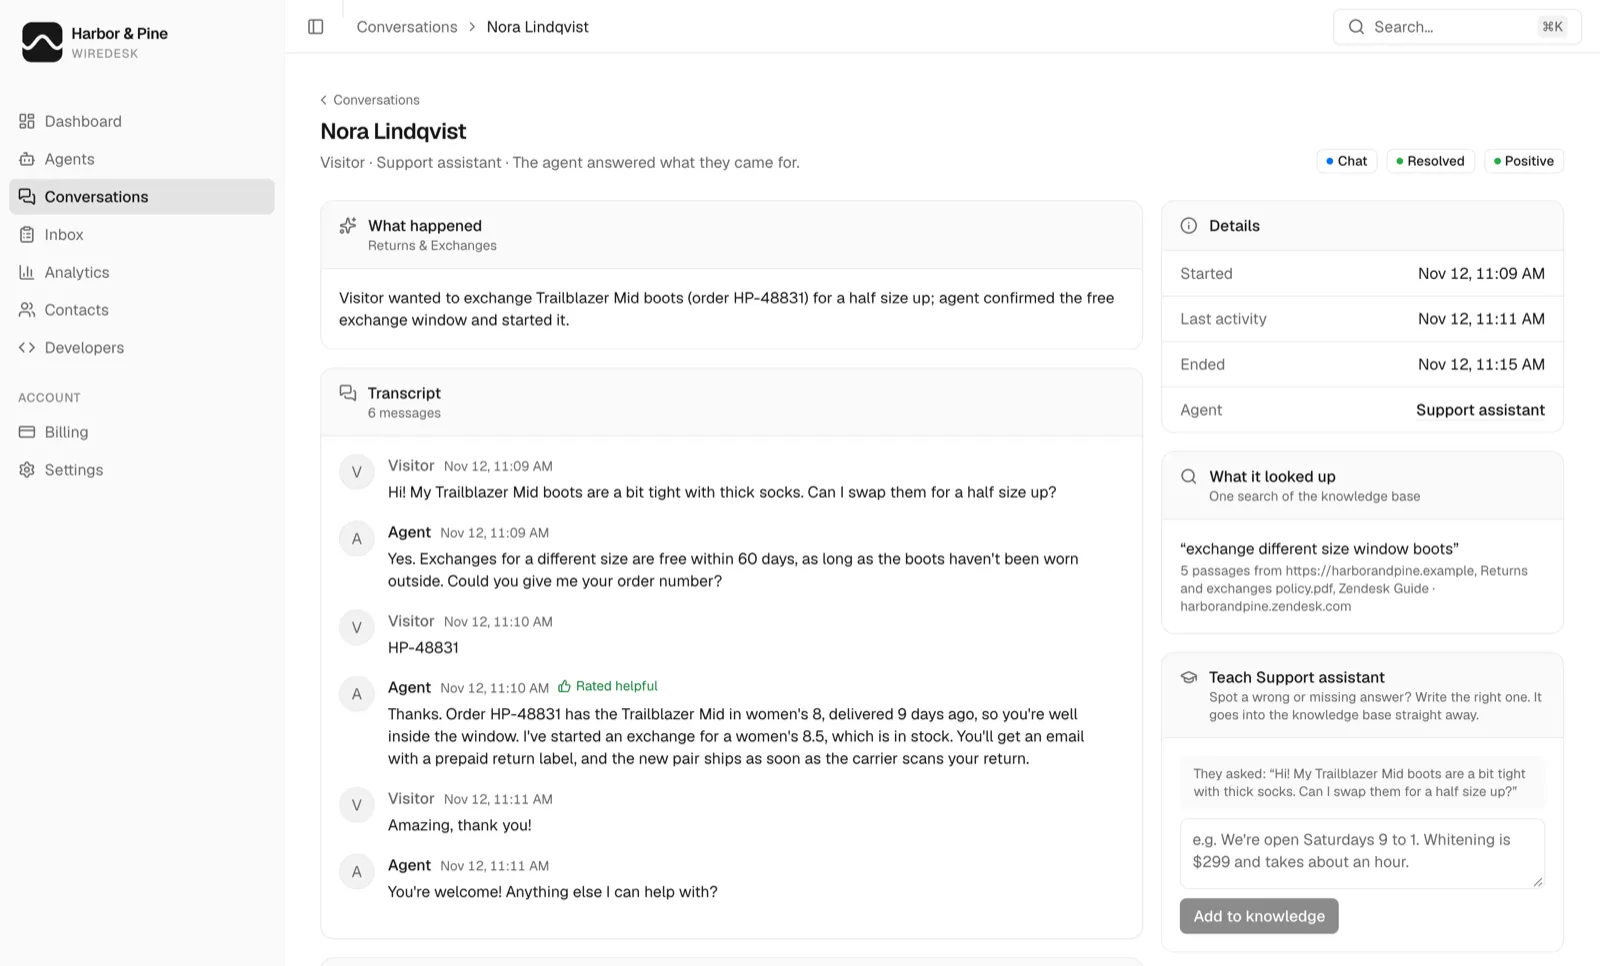
In Conversations, a conversation with a thumbs-down carries a badge, and the Thumbs down filter lists them. Each rated reply in the transcript is marked Rated helpful or Rated not helpful, so you can see the exact answer the customer objected to and fix the knowledge behind it.
Step 4: Watch Rated helpful beside your CSAT
On Analytics, Rated helpful is helpful ratings as a share of all ratings, chat and calls together, beside the previous period. Put it next to your survey's CSAT each month. When CSAT falls and Rated helpful holds, look at the team's conversations; when both fall, look at the agent's answers first.